As you start your hydroponic journey, you’ll probably hear a lot about certain parameters — such as pH and EC — and “measurement ranges” that your plants need to stay in. But unless you’re an experienced grower, you’re unlikely to know what these ranges are.
With that in mind, we’ve created a few charts and tables that outline each parameter — pH, EC, cF, and PPM — to get you started. These charts, which contain a broad range of values, should give you a ballpark estimate of what’s needed for each of your plants.
If you’re new to hydroponics and would like to learn more, try reading our “What is Hydroponics” guide or try exploring our Hydroponics Hobby Center for all the latest and greatest information!
Table of Contents:
- Measurement Definitions
- Hydroponic Vegetable Chart
- Hydroponic Root Vegetable Chart
- Hydroponic Herbs Chart
- Hydroponic Fruits Chart
- Why We Should Use EC over PPM
- Calculations Explained
- TDS For Water Chart
- Additional Considerations

Measurement Definitions
There are 5 “measurement terms” that you’ll likely encounter when researching how to grow your plants — pH, TDS, EC, cF, and PPM. Here’s what each one means:
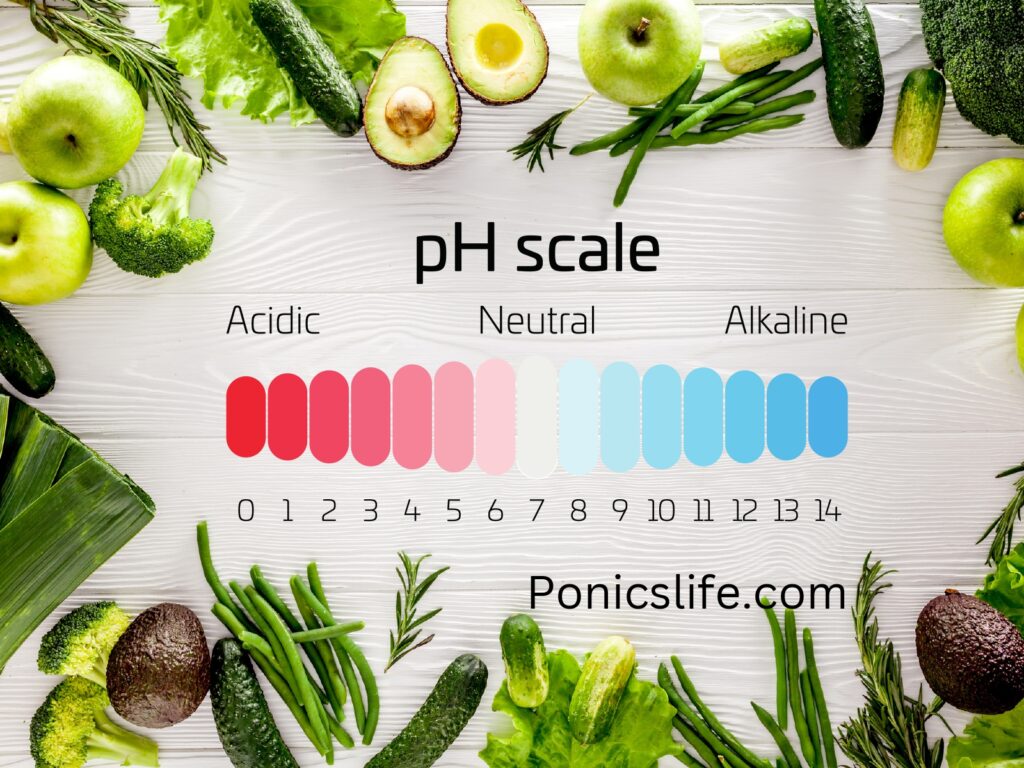
- pH (Potential for Hydrogen): Measure of how acidic or basic water is using a 14 point scale.
- TDS (Totally Dissolved Solids): Refers to the amount of substances — such as salts, minerals, metals, etc — that have been dissolved in water.
- EC (Electrical Conductivity): Measures how well a liquid can carry a current through it.
- PPM (Parts Per Million): Measures the concentration of elements in your nutrient solution.
- cF (Conductivity Factor): Measures electrically charged nutrient ions in your nutrient solution.
So what’s all of this actually mean? Well, outside of pH (which we explain in detail here), all of the other parameters listed above — to include TDS, EC, PPM, and cF — are essentially different scales measuring the same thing (similar to how Celsius and Fahrenheit are both measurements for temperature).
Are they technically different? Yes. But for you, the everyday hobbyist, all you really need to know is that although they are expressed differently, any one of them will give you the same answer.
And how do I know this? Well, because there’s a formula.
Basically, EC and cF can be expressed as either milliSiemens (mS), Conductivity Factor (cF), or parts per million (PPM). Thus, the Formula is as follows: 1 mS = 10cF = 700ppm
For example, if you stumbled on some information that says lettuce falls between 560 and 840 ppm (which is indeed correct), then you can reasonably assume that it also has an EC of 0.8 to 1.2. Why? Because the formula says so.
But isn’t there a 500 ppm scale too?
Yes, in fact, there are a few scales, but the two most popular ppm scales are the 700 and 500. So what does this mean for you? Well, not much (at least in terms of knowing what it is). Basically, instead of your formula being 1 mS = 10cF = 700ppm, it’s now 1 mS = 10cF = 500ppm.
So which one is better to use?
While we’ll go into more detail below (following the charts), we recommend that you use neither the 500 nor the 700 ppm scale. Instead, just focus on EC. Measuring EC is easier, more accurate, and more consistent (and is increasingly becoming the hobbyist standard).
Regardless of which one you use, however, your job as a hydroponic hobbyist is to keep each plant within its optimal range. And lucky for you, we’ve provided you with a cheat sheet to do just that.
Hydroponic Vegetable Chart: pH, EC, cF, and PPM
| Vegetable | pH | EC | cF | PPM (700 Scale) | PPM (500 Scale) |
|---|---|---|---|---|---|
| Artichoke | 6.5 – 7.5 | 0.8 – 1.8 | 8 – 18 | 560 – 1260 | 400 – 900 |
| Asparagus | 6.0 – 6.8 | 1.4 – 1.8 | 14 – 18 | 980 – 1260 | 700 – 900 |
| Bean (Common) | 6.0 | 2-4 | 20 – 40 | 1400 – 2800 | 1000 – 2000 |
| Beans (Italian bush) | 6.0 – 6.5 | ||||
| Beans (Lima) | 6.0 – 6.5 | ||||
| Beans (Pole) | 6.0 – 6.5 | ||||
| Broad Bean | 6.0 – 6.5 | 1.8 – 2.2 | 18 – 22 | 1260 – 1540 | 900 – 1100 |
| Broccoli | 6.0 – 6.5 | 2.8 – 3.5 | 28 – 35 | 1960 – 2450 | 1400 – 1750 |
| Brussell Sprout | 6.5 – 7.5 | 2.5 – 3.0 | 25 – 30 | 1750 – 2100 | 1250 – 1500 |
| Cabbage | 6.5 – 7.0 | 2.5 – 3.0 | 25 – 30 | 1750 – 2100 | 1250 – 1500 |
| Capsicum | 6.0 – 6.5 | 1.8 – 2.2 | 18 – 22 | 1260 – 1540 | 900 – 1100 |
| Cauliflower | 6.0 – 7.0 | 0.5 – 2.0 | 5 – 20 | 1050 – 1400 | 250 – 1000 |
| Celery | 6.5 | 1.8 – 2.4 | 18 – 24 | 1260 – 1680 | 900 – 1200 |
| Collard greens | 6.5 – 7.5 | ||||
| Cucumber | 5.8 – 6.0 | 1.7 – 2.5 | 17 – 25 | 1190 – 1750 | 850 – 1250 |
| Eggplant | 5.5 | 2.5 – 3.5 | 25 – 35 | 1750 – 2450 | 1250 – 1750 |
| Endive | 6.0 | 2.0 – 2.4 | 20 – 24 | 1400 – 1680 | 1000 – 1200 |
| Fodder | 6.0 | 1.8 – 2.0 | 18 – 20 | 1260 – 1400 | 900 – 1000 |
| Lettuce | 5.5 – 6.5 | 0.8 – 1.2 | 8 – 12 | 560 – 840 | 400 – 600 |
| Marrow | 6.0 | 1.8 – 2.4 | 18 – 24 | 1260 – 1680 | 900 – 1200 |
| Okra | 6.5 | 2.0 – 2.4 | 20 – 24 | 1400 – 1680 | 1000 – 1200 |
| Pak-choi | 7.0 | 1.5 – 2.0 | 15 – 20 | 1050 – 1400 | 750 – 1000 |
| Pea | 6.0 – 7.0 | 0.8 – 1.8 | 8 – 18 | 980 – 1260 | 400 – 900 |
| Peas (Sugar) | 6.0 – 6.8 | ||||
| Pepino | 6.0 – 6.5 | 2.0 – 5.0 | 20 – 50 | 1400 – 3500 | 1000 – 2500 |
| Peppers | 5.8 – 6.3 | 2.0 – 3.0 | 20 – 30 | 1400 – 2100 | 1000 – 1500 |
| Bell peppers | 6.0 – 6.5 | 2.0 – 2.5 | 20 – 25 | 1400 – 1750 | 1000 – 1250 |
| Hot Peppers | 6.0 – 6.5 | 3.0 – 3.5 | 30 – 35 | 2100 – 2450 | 1500 – 1750 |
| Pumpkin | 5.5-7.5 | 1.8 – 2.4 | 18 – 24 | 1260 – 1680 | 900 – 1200 |
| Radicchio | 5.5 – 6.5 | ||||
| Spinach | 5.5 – 6.6 | 1.8 – 2.3 | 18 – 23 | 1260 – 1610 | 900 – 1150 |
| Sweet Corn | 6.0 | 1.6 – 2.4 | 16 – 24 | 840 – 1680 | 800 – 1200 |
| Swiss chard | 6.0 – 6.5 | 1.6 – 2.3 | 16 – 23 | 800 – 1150 | 800 – 1150 |
| Squash (Summer) | 5.0 – 6.5 | 1.8 – 2.4 | 18 – 24 | 1260 – 1680 | 900 – 1200 |
| Squash (Winter) | 5.0 – 6.5 | ||||
| Taro | 5.0 – 5.5 | 2.5 – 3.0 | 25 – 30 | 1750 – 2100 | 1250 – 1500 |
| Tomato | 5.5 – 6.5 | 2.0 – 5.0 | 20 – 50 | 1400 – 3500 | 1000 – 2500 |
| Zucchini | 6.0 | 1.8 – 2.4 | 18 – 24 | 1260 – 1680 | 900 – 1200 |
Hydroponic Root Vegetable Chart: pH, EC, cF, and PPM
| Root Vegetable | pH | EC | cF | PPM (700 Scale) | PPM (500 Scale) |
|---|---|---|---|---|---|
| Beetroot | 6.0 – 6.5 | 0.8 – 5.0 | 8 – 50 | 1260 – 3500 | 400 – 2500 |
| Carrots | 6.3 | 1.6 – 2.0 | 16 – 20 | 1120 – 1400 | 800 – 1000 |
| Garlic | 6.0 | 1.4 – 1.8 | 14 – 18 | 980 – 1260 | 700 – 900 |
| Leek | 6.5 – 7.0 | 1.4 – 1.8 | 14 – 18 | 980 – 1260 | 700 – 900 |
| Onions | 6.0 – 6.7 | 1.4 – 1.8 | 14 – 18 | 980 – 1260 | 700 – 900 |
| Parsnip | 6.0 | 1.4 – 1.8 | 14 – 18 | 980 – 1260 | 700 – 900 |
| Potato | 5.0-6.0 | 2.0 – 2.5 | 20 – 25 | 1400 – 1750 | 1000 – 1250 |
| Radish | 6.0 – 7.0 | 1.6 – 2.2 | 16 – 22 | 840 – 1540 | 800 – 1100 |
| Silverbeet | 6.0 – 7.0 | 1.8 – 2.3 | 18 – 23 | 1260 – 1610 | 900 – 1150 |
| Sweet Potato | 5.5 – 6.0 | 2.0 – 2.5 | 20 – 25 | 1400 – 1750 | 1000 – 1250 |
| Turnip | 6.0 – 6.5 | 1.8 – 2.4 | 18 – 24 | 1260 – 1680 | 900 – 1200 |
Hydroponic Herbs Chart: pH, EC, cF, and PPM
| Herb | pH | EC | cF | PPM (700 Scale) | PPM (500 Scale) |
|---|---|---|---|---|---|
| Basil | 5.5 – 6.5 | 1.0 – 1.6 | 10 – 16 | 700 – 1120 | 500 – 800 |
| Chicory | 5.5 – 6.0 | 2.0 – 2.4 | 20 – 24 | 1400 – 1600 | 1000 – 1200 |
| Chives | 6.0 – 6.5 | 1.8 – 2.4 | 18 – 22 | 1260 – 1540 | 900 – 1200 |
| Fennel | 6.4 – 6.8 | 1.0 – 1.4 | 10 – 14 | 700 – 980 | 500 – 700 |
| Lavender | 6.4 – 6.8 | 1.0 – 1.4 | 10 – 14 | 700 – 980 | 500 – 700 |
| Lemon Balm | 5.5 – 6.5 | 1.0 – 1.6 | 10 – 16 | 700 – 1120 | 500 – 800 |
| Marjoram | 6.0 | 1.6 – 2.0 | 16 – 20 | 1120 – 1400 | 800 – 1000 |
| Mint | 5.5 – 6.0 | 2.0 – 2.4 | 20 – 24 | 1400 – 1680 | 1000 – 1200 |
| Mustard Cress | 6.0 – 6.5 | 1.2 – 2.4 | 12 – 24 | 840 – 1680 | 600 – 1200 |
| Parsley | 5.5 – 6.0 | 0.8 – 1.8 | 8 – 18 | 560 – 1260 | 400 – 900 |
| Rosemary | 5.5 – 6.0 | 1.0 – 1.6 | 10 – 16 | 700 – 1120 | 500 – 800 |
| Sage | 5.5 – 6.5 | 1.0- 1.6 | 10 – 16 | 700 – 1120 | 500 – 800 |
| Thyme | 5.5 – 7.0 | 0.8 – 1.6 | 8 – 16 | 560 – 1120 | 400 – 800 |
| Watercress | 6.5 – 6.8 | 0.4 – 1.8 | 4 – 18 | 280 – 1260 | 200 – 900 |
Hydroponic Fruits Chart: pH, EC, cF, and PPM
| Fruit | pH | EC | cF | PPM (700 Scale) | PPM (500 Scale) |
|---|---|---|---|---|---|
| Banana | 5.5 – 6.5 | 1.8 – 2.2 | 18 – 22 | 1260 – 1540 | 900 – 1100 |
| Black Currant | 6.0 | 1.4 – 1.8 | 14 – 18 | 980 – 1260 | 700 – 900 |
| Blueberry | 4.0 -5.0 | 1.8 – 2.0 | 18 – 20 | 1260 – 1400 | 900 – 1000 |
| Melon | 5.5 – 6.0 | 2.0 – 2.5 | 20 – 25 | 1400 – 1750 | 1000 – 1250 |
| Passionfruit | 6.5 | 1.6 – 2.4 | 16 – 24 | 840 – 1680 | 800 – 1200 |
| Paw-Paw | 6.5 | 2.0 – 2.4 | 20 – 24 | 1400 – 1680 | 1000 – 1200 |
| Pineapple | 5.5 – 6.0 | 2.0 – 2.4 | 20 – 24 | 1400 – 1680 | 1000 – 1200 |
| Red Currant | 6.0 | 1.4 – 1.8 | 14 – 18 | 980 – 1260 | 700 – 900 |
| Rhubarb | 5.0 – 6.0 | 1.6 – 2.0 | 16 – 20 | 840 – 1400 | 800 – 1000 |
| Strawberries | 5.5 – 6.5 | 1.8 – 2.2 | 18 – 22 | 1260 – 1540 | 900 – 1100 |
| Watermelon | 5.8 | 1.5 – 2.4 | 15 – 24 | 1260 – 1680 | 750 – 1200 |
Why We Should Measure EC over PPM
As discussed above, EC is a measure of electrical conductivity, which is basically how well a liquid can carry a current through it. And fortunately, in hydroponics, the nutrient minerals added to your water are pretty conductive. Thus, when you go to measure “EC”, you’re pretty much measuring the amount of nutrients in your solution.
TDS (Total Dissolved Solids), on the other (very similar) hand, measures the amount of substances — such as salts, minerals, metals, etc — that have been dissolved in water and is reported in parts per million, also known as PPM.
So if they’re basically the same, then why should we use EC over PPM?
There are several reasons why it’s probably better to use EC over PPM:
- Firstly, standard meters are equipped with two probes at their base. Once dipped into your solution, these probes assess how easily electricity can pass through the water. The meter then performs a swift calculation to convert this EC reading into a Parts Per Million (PPM) value, thus providing the PPM result. This means that your meter, in most situations, is most accurately reporting EC because that’s what it’s specifically designed to do before having to make an internal calculation.
- Secondly, after your meter has made the internal calculations, it will report out numbers using the 500 or the 700 ppm scale. And, as you can probably tell, these are two very different numbers. This, in turn, can lead to a lot of confusion, as the conversion method being used by a particular meter isn’t always clear.
- Thirdly, the hydroponics community is increasingly adopting EC as the go-to measurement over PPM (especially in online forums). The idea is that when everyone uses the same measurement unit, it simplifies the process of exchanging insights, comparing growth techniques, and discussing nutrient solutions, all while eliminating potential confusion and inaccuracies that arise from converting between different PPM scales.
Calculation Example(s) for EC, cF, and PPM
While pH is pretty straightforward, the other parameters are a little more confusing. As stated above, although they generally indicate the same thing, they use different numbers. To help you better understand the calculation process, let’s use an example from our chart and look at the requirements for common beans using the 700 ppm scale.
Beans fall within the following range:
- EC Range: 2 – 4
- cF Range: 20 – 40
- PPM Range: 1400 – 2800
So let’s say we were only given an EC range but we want to know cF and PPM too. Well, if we know to use our formula of — 1 mS = 10cF = 700ppm — and we know that common beans have an EC range of 2 to 4, then we should have everything we need. Here’s how that would work:
- To calculate cF, our minimum range of “2 EC” would be 2 x 10 = 20 cF … and our maximum range of “4 EC” would be 4 x 10 = 40 cF
- To calculate PPM, our minimum range of “2 EC” would be 2 x 700 = 1400 ppm … and our maximum range of “4 EC” would be 4 x 700 = 2800 ppm.
Similarly, if we were only given the PPM range for beans, which is 1400 to 2800, then we work the other way around to calculate cF and EC.
- To Calculate cF, our minimum range of “1400 PPM” would be 1400 ÷ 70 = 20 cF … and our maximum range of “2800 PPM” would be 2800 ÷ 70 = 40 cF.
- To Calculate EC, our minimum range of “1400 PPM” would be 1400 ÷ 700 = 2 EC … and our maximum range of “2800 PPM” would be 2800 ÷ 700 = 4 EC.
Use these if you know at least one of your parameters:
- 1 EC always equals 10 CF
- 1 EC always equals 700 PPM
- EC multiplied by 10 equals your CF
- CF divided by 10 equals your EC
- EC multiplied by 700 equals your PPM
- PPM divided by 70 equals your CF
- PPM divided by 700 equals your EC
TDS For Water Found in Nature
| Type of Water | TDS Level |
|---|---|
| Brackish | Up to 5000 ppm |
| Brine | Above 40,000 ppm |
| Freshwater | Less than 1000 ppm |
| Saline | Between 15,000 – 30,000 ppm |
| Sea Water | Between 30,000 – 40,000 ppm |
Additional Considerations for Hydroponics
These Charts are JUST for Hydroponic Plants: If you’re growing in soil, you still need to pay attention to pH and EC, but don’t use any of these charts. Because soil has different needs, the parameters for soil-grown plants will greatly differ.
Winter vs Summer Months: Climate is a big deal if growing outside in the elements. Your plants will have a higher need for nutrients in winter and a lower need for nutrients during the summer months. Adjust your nutrient solution accordingly.
Should I use an EC or TDS meter? Ideally, it’s better to use an EC meter as we’ve outlined above. However, if your nutrient recommendations refer to PPM instead of EC, then it might be easier to use a TDS meter. The good news is that most meters are typically able to measure both.
How Exact do My Numbers Need to Be? Bottom line up front, don’t focus on the exact decimal; just stay in the general ballpark and you’ll be ok. If a plant has an ideal pH of 6.5, just get in the general vicinity of 6.5 and you’ll be good to go.


